November 13: India’s merchandise exports rose 45% in October 2026 to $49.47 billion from $34.11 billion a year earlier, the Commerce Ministry said on Thursday, with petroleum products, electronics and engineering goods leading the jump. Imports grew more slowly, by 16.5% to $89.35 billion, so the goods trade deficit narrowed to $39.88 billion from $42.58 billion.
Key highlights
- Goods exports, October: $49.47 billion, up 45.0%.
- Goods imports, October: $89.35 billion, up 16.5%.
- Petroleum product exports: $8.89 billion, up 140.21%.
- Electronic goods exports: $6.64 billion, up 62.70%.
- Goods and services together, April–October: exports $568.84 billion (up 16.66%), imports $662.19 billion (up 16.00%).
- Services: October figures are estimates; the latest RBI services data are for September.
October at a glance
| US$ billion | October 2026 | October 2025 |
|---|---|---|
| Merchandise exports | 49.47 | 34.11 |
| Merchandise imports | 89.35 | 76.69 |
| Services exports (estimate) | 40.51 | 35.17 |
| Services imports (estimate) | 20.72 | 17.73 |
| Total exports | 89.99 | 69.27 |
| Total imports | 110.07 | 94.42 |
What drove exports
| Product group | October 2025 | October 2026 | Growth |
|---|---|---|---|
| Engineering goods | $9.37 bn | $12.74 bn | 36.01% |
| Petroleum products | $3.70 bn | $8.89 bn | 140.21% |
| Electronic goods | $4.08 bn | $6.64 bn | 62.70% |
| Gems and jewellery | $2.29 bn | $3.21 bn | 40.06% |
| Organic and inorganic chemicals | $2.12 bn | $2.89 bn | 36.20% |
The growth was broad. Exports excluding petroleum and gems and jewellery, a measure of the core of India’s goods trade, rose to $37.38 billion from $28.11 billion. Other cereals (87.47%), oil meals (85.55%), handicrafts (55.22%) and rice (18.39%) also grew. Pharmaceuticals rose 10.55%.
Where the goods went, and where imports came from
The biggest increases in exports in October were to the United States (up 39.25%), Spain (352.07%), Singapore (139.1%), Malaysia (280.72%) and China (48.15%). On the import side, the largest increases came from China (46.48%), Russia (73.17%), the United States (29.17%), Malaysia (88.51%) and Indonesia (75.07%).
Our calculation
| Question | Answer | How we got it |
|---|---|---|
| Goods trade deficit, October | $39.88 bn (vs $42.58 bn) | Imports minus exports |
| Services surplus, October (estimate) | $19.79 bn | $40.51 bn − $20.72 bn |
| Overall deficit, goods and services | About $20.09 bn (vs $25.14 bn) | Total imports minus total exports |
| Share of the export increase from three groups | About 72% | Petroleum (+$5.19 bn), engineering (+$3.37 bn) and electronics (+$2.56 bn) out of +$15.36 bn |
| Goods trade deficit, April–October | $218.15 bn (vs $199.46 bn) | Ministry figures |
What it means for India and Asia
A narrower monthly deficit can ease some pressure on the rupee. But the seven-month goods deficit is still about $19 billion wider than a year ago, which shows that imports remain heavy, with the biggest increases coming from China and Russia. Services exports, which earned an estimated $124.80 billion more than India spent on services in April–October, continue to cover a large part of the gap.
For Asia, the data show India’s trade becoming more regional on both sides. Singapore and Malaysia were among the fastest-growing export markets, and Malaysia and Indonesia among the fastest-growing sources of imports.
What to watch
- RBI services trade data for October, which will replace the estimate.
- Whether petroleum product exports hold up as global fuel prices move.
- November trade data, due in mid-December.
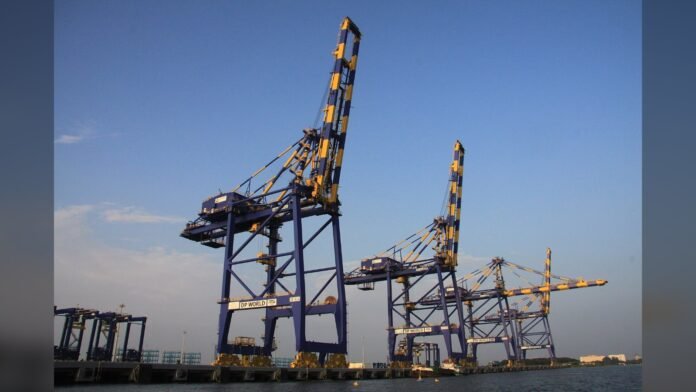
Cranes at the Vallarpadam international container terminal in Kochi. Image: Bharat S Raj, CC BY-SA 3.0, via Wikimedia Commons. Photo source · Licence
Sources

The Business Desk covers markets, the economy, companies and personal finance. Stories are checked against at least two credible sources before publication.