
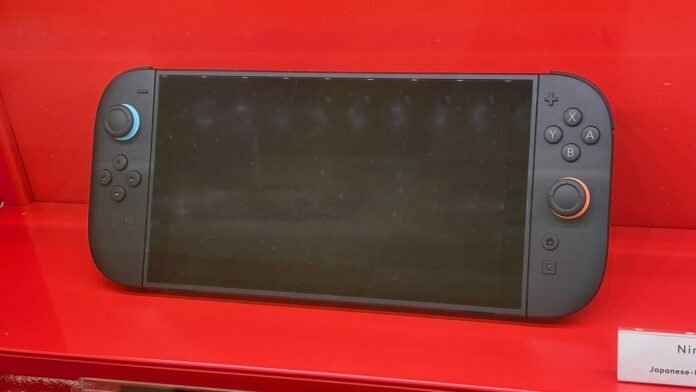
November 6: Nintendo reported a 49.1% increase in half-year operating profit despite a 12.1% decline in net sales, in results released on November 5. The Japanese company’s figures show why revenue, hardware units and profit can move in different directions during the same reporting period.
Key highlights
- Net sales were ¥966.041 billion for April–September 2026.
- Operating profit reached ¥216.5 billion; profit attributable to owners was ¥220.917 billion.
- Switch 2 hardware sales were 6.49 million units during the six months, not its lifetime total.
- Nintendo kept its full-year financial forecast unchanged.
What the headline numbers show
Nintendo’s consolidated results cover the six months ended September 30, the first half of its financial year ending March 2027. Revenue fell to ¥966.041 billion, while operating profit increased to ¥216.5 billion. Profit attributable to owners rose 11.0% to ¥220.917 billion. These are different accounting measures, so the operating-profit percentage should not be attached to the bottom-line figure.
The operating margin was 22.4%, compared with 13.2% a year earlier. The comparison shows that Nintendo retained more operating profit from each yen of sales. It does not mean that every product became more profitable or that the same margin will necessarily continue in the second half.
Why the tariff refund matters
The company’s explanatory materials said approximately US$300 million in IEEPA tariff refunds was recorded in the first quarter as a reduction in cost of sales. That is an important item when interpreting the rise in profitability: a cost adjustment is different from additional demand for a game or console.
It would nevertheless be inaccurate to describe the entire profit increase as a tariff refund. Nintendo also reported changes in software, digital business and intellectual-property-related income. The useful approach is to examine the components rather than infer the health of the whole business from revenue alone.
Hardware and software are different stories
Nintendo reported 6.49 million Switch 2 hardware units sold during April–September, down 37.4% against the comparative period. Switch 2 software volume rose 18.8% to 24.49 million units. Digital sales increased 60.5% to ¥249.6 billion, while intellectual-property-related income rose to ¥62.7 billion.
The hardware figure is a period total. Calling it the console’s installed base would be wrong. Similarly, software units do not establish how many unique people bought a game, and digital sales are a revenue measure rather than a hardware count. Keeping those units clear is essential when comparing the different parts of the results.
For developers and retailers across Asia, the mix matters because the commercial opportunity is not limited to new console shipments. Software demand can develop differently from hardware demand. This is an implication of the reported mix, not a forecast for an individual developer’s revenue.
The unchanged outlook
Nintendo retained its full-year forecast of ¥2.05 trillion in net sales and ¥370 billion in operating profit. An unchanged forecast means management did not revise those targets in this release; it does not make them guaranteed outcomes.
Our calculation: subtracting first-half operating profit of ¥216.5 billion from the ¥370 billion annual forecast leaves ¥153.5 billion for the second half if the annual forecast is met. This is an arithmetic implication of guidance, not a newly reported result or separate company forecast.
What to watch
The next results will show whether software sales, digital income and hardware demand sustain the first-half pattern. Comparisons should also separate recurring trading performance from the tariff-related cost adjustment. This article reports company results and does not recommend buying or selling Nintendo shares.
At a glance
| Item | What the official record says |
|---|---|
| Reporting period | April 1–September 30, 2026 |
| Net sales | ¥966.041 billion; down 12.1% |
| Operating profit | ¥216.5 billion; up 49.1% |
| Switch 2 hardware | 6.49 million units during the half year |
| Full-year operating-profit forecast | ¥370 billion; unchanged |
Sources
- Nintendo: Consolidated financial statements, six months ended September 30
- Nintendo: Financial results explanatory material

The Business Desk covers markets, the economy, companies and personal finance. Stories are checked against at least two credible sources before publication.