NEW DELHI, November 3: Extreme poverty in India fell from 27.1% of the population in 2011 to 2.6% in 2023, according to the World Bank’s latest India Poverty and Equity Brief, published in October 2026. Using the higher $4.20-a-day line for lower-middle-income countries, poverty fell from 57.7% to 16.1%, lifting about 496 million people above that threshold. The Bank says the decline is among the fastest anywhere, but warns that remaining poverty is concentrated in rural areas and a belt of eastern states.
Key highlights
- Extreme poverty ($3.00 a day, 2021 prices): 27.1% in 2011, 2.6% in 2023 — about 75.2 million people.
- Poverty at $4.20 a day: 57.7% in 2011, 16.1% in 2023 — about 342.3 million people.
- About 57% of India’s poor live in a belt stretching from Uttar Pradesh to West Bengal.
- Rural poverty at $4.20 a day was 19.3% in 2023, against 8.6% in urban areas.
- The Bank projects the $4.20 rate falling from 14.2% in 2026 to 12.1% in 2028.
The numbers
| Poverty line (per person per day, 2021 PPP) | 2011 | 2023 | People in 2023 |
|---|---|---|---|
| $3.00 (extreme poverty) | 27.1% | 2.6% | ~75.2 million |
| $4.20 (lower-middle-income line) | 57.7% | 16.1% | ~342.3 million |
| $8.30 (upper-middle-income line) | — | 80.0% | ~1.15 billion |
| Indicator | Value |
|---|---|
| Rural poverty, $4.20 line (2023) | 19.3% |
| Urban poverty, $4.20 line (2023) | 8.6% |
| Gini index (2023) | 23.0 |
| Multidimensional poverty, OPHI measure | 53.8% (2005–06) → 16.4% (2019–21) |
| Multidimensional poverty, World Bank measure (2022–23) | 15.5% |
| Projected $4.20 poverty rate | 14.2% (2026) → 12.1% (2028) |
What drove the fall
The World Bank attributes the decline to consumption growth, more people in work — especially rural women entering paid jobs — and larger transfers such as food subsidies. It says employment rose by about 134 million between 2017 and 2023, nearly twice as fast as the working-age population. The estimates draw on the 2011–12 Consumer Expenditure Survey and the 2022–23 and 2023–24 Household Consumption Expenditure Surveys, which the Bank treats as broadly comparable, while noting that part of the recent improvement may reflect better measurement.
The caveats
The Bank cautions that consumption surveys may not fully capture spending by richer households, so inequality is probably understated. It reports that youth unemployment rose from 14.6% to 15.9% between the first quarter of FY2026 and the first quarter of FY2027, especially among young rural women, and that real earnings were broadly unchanged, with job growth concentrated in low-productivity work. Remaining poverty is concentrated among households with less education, fewer assets, insecure jobs and more dependants.
Our calculation
- Extreme poverty cut by 90%: a fall from 27.1% to 2.6% means the share in extreme poverty dropped by about nine-tenths in 12 years.
- Most of the population is still near the line: 80% of Indians lived below the $8.30 upper-middle-income line in 2023, so most people who escaped extreme poverty remain vulnerable.
- Rural gap: rural poverty at the $4.20 line (19.3%) is more than twice the urban rate (8.6%).
What it means
The figures confirm a large reduction in extreme deprivation, but they also show how many Indians live just above the poverty lines. With most of the remaining poor in a few populous eastern states and many new jobs in low-productivity work, the Bank’s message is that further progress depends on better-paid jobs in that belt rather than on transfers alone.
What to watch
- The next Household Consumption Expenditure Survey results, which will update the estimates.
- Youth and rural women’s employment in the Periodic Labour Force Survey.
- State-level poverty trends in Uttar Pradesh, Bihar, Jharkhand and West Bengal.
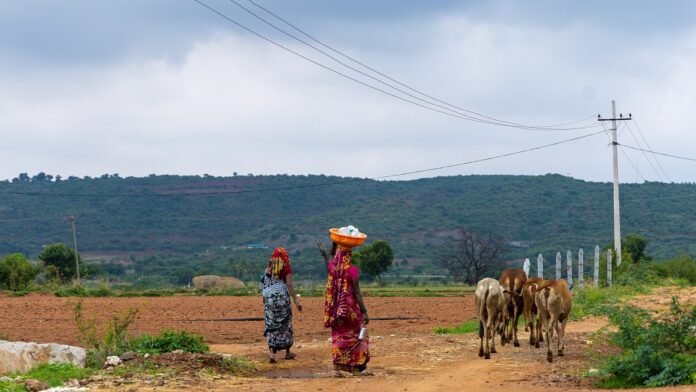
File photo: women and cattle on a village road in Raichur district, Karnataka, 2026. Image: Vraj Acharya, WELL Labs, CC BY-SA 4.0, via Wikimedia Commons. Photo source · Licence
Sources
- World Bank: India Poverty and Equity Brief, October 2026 (PDF)
- World Bank: India Poverty and Equity Brief, October 2026 (document page)
- World Bank: Poverty and Equity Briefs

The Business Desk covers markets, the economy, companies and personal finance. Stories are checked against at least two credible sources before publication.