
US consumer inflation accelerated to 3.7% over the year to September 2026, as a sharp increase in gasoline prices pushed up the monthly reading. The Consumer Price Index rose 0.6% from August on a seasonally adjusted basis, the Bureau of Labor Statistics reported on October 14.
The BLS release puts August’s annual inflation rate at 3.4% and its monthly increase at 0.4%. The new figures therefore show faster price growth on both comparisons.
Energy explains much of the increase
Gasoline prices rose 9.1% in September, accounting for more than half the overall monthly rise. The broader energy index increased 5.2%, while shelter rose 0.4%. Food prices were unchanged overall for the month.
| Measure | September change |
|---|---|
| Headline CPI, month on month | +0.6% |
| Headline CPI, year on year | +3.7% |
| Core CPI, month on month | +0.3% |
| Core CPI, year on year | +2.6% |
Core CPI excludes food and energy. Its annual increase was up from 2.4% in August, meaning the report cannot be reduced entirely to gasoline even though fuel was the largest immediate driver.
How to read the two time periods
A monthly rate compares September with August. An annual rate compares September with the same month a year earlier. They are not interchangeable, and multiplying one monthly observation by 12 does not reproduce the reported annual figure.
Seasonal adjustment also matters. It helps remove recurring calendar effects from short-term comparisons. The annual headline number quoted here is the unadjusted 12-month measure, following the BLS presentation.
Why households may experience something different
The BLS methodology FAQ explains that CPI describes a weighted basket rather than every family’s personal bill. A household that drives frequently may notice fuel increases more than one that relies on public transport, while housing arrangements change exposure to shelter costs.
The figures are a price report, not a Federal Reserve interest-rate decision. Any claim that a particular policy move is now certain would go beyond what these data establish. Subsequent inflation, labour-market releases and official policy statements will provide the next evidence.
Image credit and licence
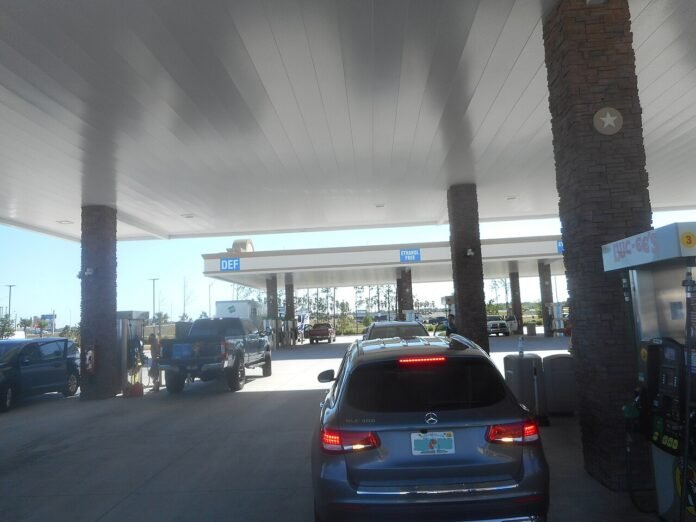
File photo: fuel pumps at Buc-ee’s in Daytona Beach, Florida, March 23, 2023; not a September 2026 price survey. Photo: DanTD / Wikimedia Commons, CC BY-SA 4.0. Resized for display; image adaptations retain CC BY-SA 4.0. Original image and provenance · Licence / usage terms.

The Business Desk covers markets, the economy, companies and personal finance. Stories are checked against at least two credible sources before publication.