November 18: India’s electronic-goods exports reached $31.97 billion in April–September 2026–27, up 44% from a year earlier, according to a Commerce Ministry release issued on November 17. Smartphones remained the largest segment, but the faster-growing non-smartphone category increased its share.
Key highlights
- Smartphone exports totalled $18.17 billion, up 35.8%.
- Non-smartphone exports rose 56.5% to $13.79 billion.
- The reporting period is the financial year’s first six months, not the whole year.
What changed in the export basket
The ministry puts the smartphone share at 56.8%, down from 60.3% a year earlier. The corresponding non-smartphone share rose to 43.2%. That is a change in composition alongside growth in both segments, rather than evidence that smartphone exports fell.
A second government export briefing also identifies electronic components and equipment as contributors to the expansion. The evidence supports a broader product mix. It does not, on its own, measure how much domestic value was added at each stage of manufacturing.
Why the very large component growth rates need context
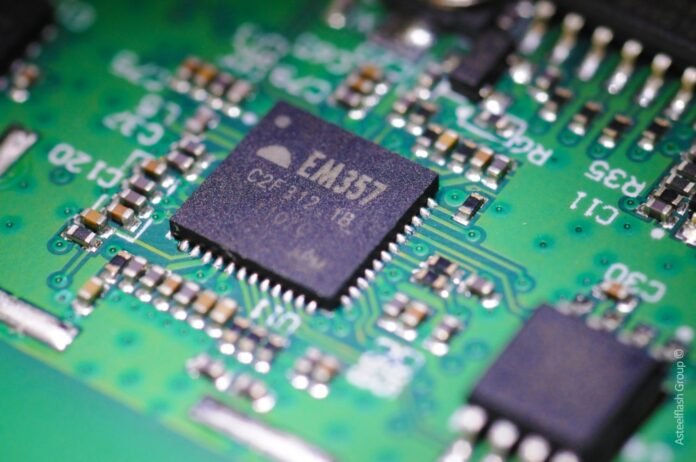
The detailed release reports sharp increases in mounted circuit boards, memory integrated circuits and storage devices, with several Asian destinations prominent. Very high percentage growth can arise when the earlier comparison base is small. It is therefore useful to show the dollar amount alongside the rate.
For readers, the more durable question is whether a category sustains higher shipments over successive periods. One exceptional increase establishes what happened in that comparison; it does not guarantee that the same percentage growth will repeat in the next half-year.
What exports do and do not measure
Export value records goods shipped abroad. It is not interchangeable with company profit, employment, local component content or the total size of the domestic electronics market. Those questions require different datasets, and this release should not be stretched into claims about them.
Our calculation: the non-smartphone share rose by 3.5 percentage points, from 39.7% to 43.2%. “Percentage points” is the appropriate unit for subtracting two shares. The published segment values may not add perfectly to the headline total because the source rounds its figures.
At a glance
| Category | April–September 2026–27 | Year-on-year growth |
| Electronic goods overall | $31.97 billion | 44.0% |
| Smartphones | $18.17 billion | 35.8% |
| Other electronics | $13.79 billion | 56.5% |
| Other electronics share | 43.2% | Up 3.5 percentage points |
What to watch
Watch the next official product-level releases for the persistence of component exports and the changing destination mix. Assessing the strength of domestic manufacturing also requires evidence on production, imported inputs and value added, not exports alone.
Sources
- Commerce Ministry: Electronic goods exports grow 44%
- PIB: Export successes across sectors and markets

The Business Desk covers markets, the economy, companies and personal finance. Stories are checked against at least two credible sources before publication.