India’s September labour-market report shows a stable headline unemployment rate, but different movements in rural and urban participation. Reading those measures together gives a clearer picture than the unemployment figure alone.
What the September PLFS reports
India’s unemployment rate for people aged 15 and above stood at 5.0% in September 2026, unchanged from August and 0.2 percentage points below September 2025, according to the Ministry of Statistics and Programme Implementation’s October 15 release.
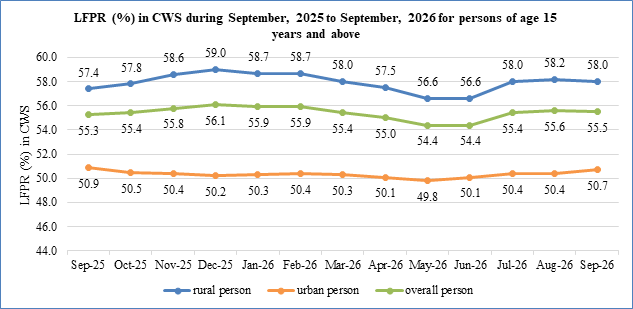
Labour force participation was 55.5%, while the worker population ratio was 52.7%. Urban female participation rose from 25.4% in August to 25.9% in September. The overall female participation rate, however, eased from 34.8% to 34.6%. An improvement in cities therefore should not be described as an improvement across every group.
Urban unemployment edged up from 6.8% to 6.9%, while rural unemployment was 4.2%, compared with 4.1% a month earlier. The national estimates cover 370,513 surveyed people and use Current Weekly Status.
Why 5% does not mean 95% of adults have jobs
The International Labour Organization distinguishes employed people, unemployed people, and those outside the labour force. The unemployment rate uses the labour force as its denominator, rather than the entire adult population. Students or other people who are not participating in the labour market are not automatically counted as unemployed.
Labour force participation measures how many working-age people are working or looking for work. The worker population ratio answers a different question: how many people in the relevant population are employed. These measures should not be interchanged.
What readers should watch next
A national average can conceal differences between locations and genders. A useful follow-up is whether participation gains persist and translate into employment, rather than treating a single month as proof of a lasting trend. These figures do not, by themselves, establish wage growth, job security or the quality of employment.
Chart credit: MoSPI / Press Information Bureau, September 2026 PLFS release. Official statistical graphic reproduced with source acknowledgement under the PIB copyright policy.
Sources
- MoSPI: September 2026 PLFS monthly bulletin, October 15
- ILO: Labour force classifications
- ILO: Labour force participation rate

The Business Desk covers markets, the economy, companies and personal finance. Stories are checked against at least two credible sources before publication.