
October 31: US compensation costs increased 0.8% in the three months ending September, while quarterly wage and salary growth slowed to 0.7%, the Bureau of Labor Statistics reported on October 30. The Employment Cost Index also showed faster annual growth in benefit costs than in wages. The release is a measure of employers’ labour costs, rather than a count of jobs created.
Key highlights
- Civilian compensation costs rose 0.8% in the quarter, seasonally adjusted.
- Wages and salaries increased 0.7%; benefit costs rose 0.9%.
- Total compensation was 3.4% higher over 12 months, not seasonally adjusted.
- The next ECI release is scheduled for January 29, 2027.
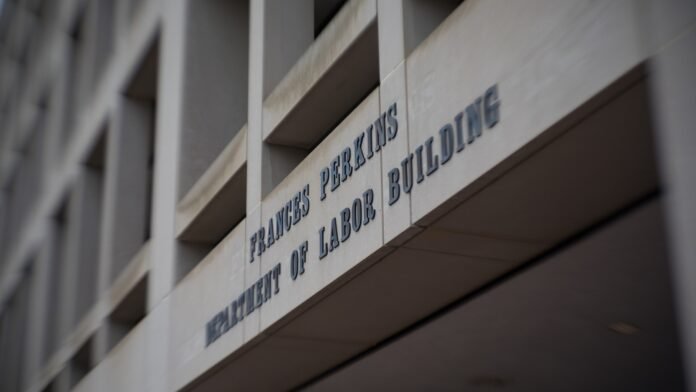
File photo: the Frances Perkins Building in Washington, DC (November 14, 2017). Photo: Shawn T. Moore / US Department of Labor / Wikimedia Commons, CC BY 2.0. Cropped and resized; the adapted image retains the stated licence. Not a photograph of the October 2026 event or current conditions.
The key BLS figures
BLS reported annual civilian wage and salary growth of 3.1% and annual benefit-cost growth of 3.9%. Private-industry compensation also rose 0.8% over the quarter. For state and local government workers, total compensation increased 0.6% over the same period.
The quarterly civilian compensation increase followed 0.9% in June’s three-month period. Quarterly civilian wages slowed from 0.9% to 0.7%, while benefits eased from 1.0% to 0.9%. The annual compensation rate was unchanged at 3.4% compared with June’s annual reading.
At a glance
| Civilian-worker measure | Quarterly change, adjusted | Annual change, unadjusted |
|---|---|---|
| Total compensation | +0.8% | +3.4% |
| Wages and salaries | +0.7% | +3.1% |
| Benefits | +0.9% | +3.9% |
What the index measures
The BLS technical note describes the ECI as a measure designed to track labour-cost change without the influence of shifts in employment between occupations and industries. That makes it conceptually different from a simple average wage, which can move when the mix of jobs changes.
For example, a workforce gaining a greater share of highly paid occupations could show a higher average wage even if pay for a particular occupation did not rise. A fixed-composition approach is intended to separate that mix effect from the cost change the index is measuring. This is a methodological illustration, not a claim about the composition of September’s hiring.
The index also includes benefits, which are part of an employer’s compensation cost but are not identical to cash pay received in a worker’s bank account. A headline about total compensation should therefore not be rewritten as a claim that every worker received the same percentage salary increase.
Nominal pay and purchasing power
Our calculation: the quarterly civilian wage increase slowed by 0.2 percentage point, from 0.9% to 0.7%. Benefits’ annual increase exceeded annual wage growth by 0.8 point, calculated as 3.9% minus 3.1%. These are comparisons between published growth rates, not dollar estimates of a worker’s compensation package.
BLS separately reported a 0.6% annual decline in inflation-adjusted civilian wages and salaries. A positive nominal wage increase and a negative real-wage change can occur together when prices rise faster than pay under the relevant adjustment. The real measure is intended to describe purchasing power, rather than the face value of wages.
Quarterly and annual figures also use different seasonal-adjustment presentations in this release. The quarterly headline is seasonally adjusted; the annual headline is not. Comparing them as if they represented the same interval or multiplying a single quarter by four without explanation would be misleading.
Why the release matters beyond the US
For Asian companies serving US customers, labour costs are one part of the wider demand and pricing picture. The data can help frame questions about business expenses and household purchasing power, but they do not directly measure Asian exports, exchange rates or the spending intentions of individual US customers.
Nor is this an announcement of monetary policy. A labour-cost release can contribute to economic analysis without determining a central bank’s next decision on its own. This report makes no prediction of an interest-rate change or a particular market response.
BLS schedules the December 2026 ECI release for January 29, 2027. It also flags updated employment weights and the removal of workers’ compensation costs beginning with that release. Readers comparing future figures should check the accompanying methodological notes as well as the headline number.
Sources
- US Bureau of Labor Statistics: September 2026 Employment Cost Index summary
- US Bureau of Labor Statistics: Employment Cost Index technical note

The Business Desk covers markets, the economy, companies and personal finance. Stories are checked against at least two credible sources before publication.