
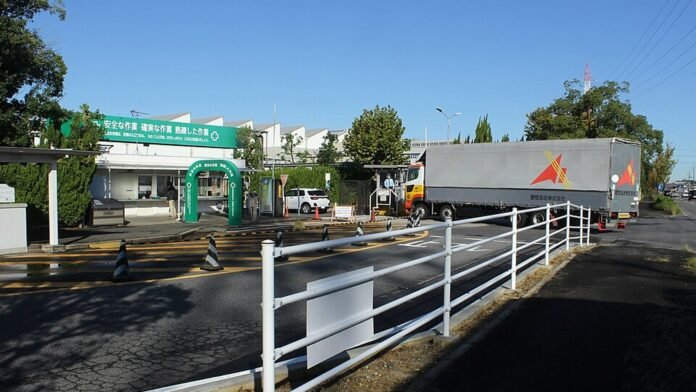
October 30: Japan’s industrial production rose 2.2% in September from the previous month, while its seasonally adjusted unemployment rate fell to 2.4%. The separate official releases published today show an improvement in factory output and labour-market conditions, with inventories also increasing.
Key highlights
- The production numbers are preliminary September readings.
- Unemployment fell by 0.1 percentage point from August.
- METI continues to describe an uneven production trend.
- Manufacturers’ forecasts are plans, rather than completed output.
Production, shipments and inventories
| METI measure, seasonally adjusted | September change from August |
|---|---|
| Industrial production | +2.2% |
| Shipments | +0.6% |
| Inventories | +2.5% |
| Inventory ratio | +2.0% |
METI identified motor vehicles, production machinery and general-purpose or business-oriented machinery among the contributors to higher output. Its overall assessment remained cautious rather than declaring a sustained manufacturing boom.
What the labour release adds
The Statistics Bureau reported 68.96 million employed people, an increase of 330,000 from a year earlier, and 1.69 million unemployed, down 150,000. These headcounts use year-on-year comparisons; the 2.4% headline unemployment rate is seasonally adjusted.
The distinction prevents a common comparison error. Dividing an unadjusted unemployed headcount by another published headcount will not necessarily reproduce an adjusted headline rate. An annual comparison also asks a different question from a change between two adjacent months.
Employment and production measure different aspects of economic activity. Output can move with hours worked, equipment use, productivity and product mix, while employment measures people. The two releases can be read together without assuming that a particular increase in factory production must generate a matching percentage increase in jobs.
Why inventory growth needs context
Our calculation: September’s production growth exceeded shipment growth by 1.6 percentage points. That comparison identifies different monthly rates; it is not a calculation of the quantity of unsold goods.
Production, shipments and stock levels have different denominators. Inventory can include inputs and goods at different stages, and the role of stocks depends on the production cycle. A stock build alone cannot establish whether businesses are preparing for orders or facing weaker sales.
The useful follow-up would examine whether shipments catch up, whether inventories continue rising and which industries account for the movements. That is a more informative test than applying one interpretation to the aggregate stock figure.
The factory outlook remains a separate measure
METI’s survey of manufacturers’ production plans points to increases of 5.1% in October and 0.8% in November. Those figures describe anticipated month-on-month changes in a survey, not production already achieved.
Plans can change when orders, inputs or operating schedules change. Comparing the eventual production releases with the plans will show how closely expectations matched activity. The survey should retain its forecast label whenever it is quoted alongside the September result.
What to watch
Revised September data and the next monthly releases will test whether the output improvement persists. Readers comparing Japan with other economies should retain the period, seasonal-adjustment status and distinction between output, shipments and employment. The photograph shows Toyota’s Takaoka plant in 2021, not September 2026 operating conditions.
Sources
- METI: September 2026 preliminary indices of industrial production
- Statistics Bureau of Japan: September 2026 Labour Force Survey monthly results

The Business Desk covers markets, the economy, companies and personal finance. Stories are checked against at least two credible sources before publication.